This post is part of the Korean Apartment Homelab series.
Introduction
In my previous posts, I covered the hardware, the services, Home Assistant, and how I expose everything through Nginx Proxy Manager. But there is one layer I skipped over: how I know when something goes wrong.
For most of the time I ran my first server, the answer was simple. I did not know. I only found out when I noticed something was slow, or when a service failed to respond.
There were two incidents that finally pushed me to set up proper monitoring.
The first was a memory issue on the old server. RAM usage had been creeping up over time, but because I never checked unless something felt wrong, I did not notice until the system was completely saturated. Services slowed to a crawl, and by the time I SSH’d in to investigate, the server had been struggling for days.
The second was worse. After a Home Assistant update, something went wrong, likely a bug in the release, and a single CPU core got pinned to 100% utilization. The system temperature stayed elevated for several days before I happened to check. Inside the storage closet of a Korean apartment, where airflow is already limited, sustained high temperatures are not just a performance issue. They are a hardware longevity risk.
Both of these would have been caught within minutes if I had any kind of alerting in place. That realization was enough to make monitoring the next thing I built.
Architecture Overview
The monitoring stack runs alongside my other services on Proxmox, split between the host and a dedicated LXC container.
On the Proxmox host itself, I run two lightweight agents:
- node_exporter — collects system-level metrics from the host
- Promtail — ships logs from the host to the central log store
Everything else runs inside a single LXC container:
- Prometheus — scrapes and stores metrics
- Grafana — visualizes metrics and logs, and handles alerting
- Loki — stores and indexes logs
The reason for this split is straightforward. node_exporter and Promtail need to run on the host because they collect host-level data: CPU, memory, disk, network, and system logs. These are things that a container cannot see from inside itself. The rest of the stack does not need host-level access, so it runs in an LXC container where it is easier to manage and snapshot.
This structure also means that if the monitoring LXC goes down, the host agents keep running and will resume sending data once the container comes back. There is no data dependency in the reverse direction, which keeps the host clean and simple.
Metrics Collection: Prometheus and Exporters
Prometheus is the core of the metrics pipeline. It scrapes data from exporters at regular intervals and stores it in a time-series database. The key advantage of Prometheus is that it pulls data rather than having agents push it, which means adding a new exporter is as simple as telling Prometheus where to find it.
I run two exporters that cover different layers of the system.
node_exporter
node_exporter runs directly on the Proxmox host and collects hardware and OS-level metrics. CPU usage per core, memory utilization, disk I/O, network throughput, filesystem usage, and system temperature are all available out of the box.
This is the exporter that would have caught both of my early incidents. The RAM saturation would have shown up as a gradual upward trend in memory usage. The stuck CPU core would have been immediately visible as one core at 100% while others were idle. With alerting on top of this data, I would have received a Telegram message within minutes of either condition appearing.
pve_exporter
pve_exporter connects to the Proxmox API and collects metrics that node_exporter cannot see. This includes the status of individual VMs and LXC containers, storage pool usage, and whether specific guests are running or stopped.
The distinction matters because node_exporter sees the host as a single machine. It knows total CPU and memory usage, but it does not know which VM or container is responsible. pve_exporter fills that gap by providing per-guest visibility. If a specific LXC container goes down, pve_exporter reports it. If a storage pool is filling up, pve_exporter catches it before node_exporter would notice the underlying filesystem change.
Running both exporters together gives me a complete picture: node_exporter for the physical layer, pve_exporter for the virtualization layer.
Log Collection: Loki and Promtail
Metrics tell you that something is wrong. Logs tell you why.
Loki is a log aggregation system designed to work with Grafana, and Promtail is the agent that ships logs into Loki. The combination is intentionally lightweight compared to alternatives like the ELK stack, which matters when you are running everything on a single homelab server.
Currently, Promtail runs on the Proxmox host and collects:
- System logs from
/var/log/*.log - systemd journal entries
This covers SSH login attempts, apt package operations, kernel messages, and systemd service lifecycle events. All of these become searchable through Grafana’s Explore interface.
The practical value might not be obvious at first. For a homelab that sits in your apartment, you might wonder why you need centralized log search. The answer became clear the first time I needed to debug a failed service restart. Instead of SSH’ing into the host and manually tailing log files, I opened Grafana, filtered by the service name and time range, and found the error in seconds. Once you experience that workflow, going back to manual log inspection feels primitive.
The current scope is limited to the Proxmox host. I have not yet extended Promtail to collect logs from individual LXC containers or VMs. That is something I plan to add, starting with the services that have been least stable, but even host-level logs alone have been worth the setup effort.
Grafana Dashboard
Grafana ties everything together into a visual interface. Rather than building dashboards from scratch, I started with two community dashboards and customized from there.
Community Dashboards
- Proxmox Dashboard (ID: 10347) — Provides an overview of VM and LXC status, storage pools, and cluster-level metrics from pve_exporter.
- Node Exporter Full (ID: 1860) — A comprehensive dashboard covering every metric node_exporter collects, from CPU and memory to disk I/O and network traffic.
Both of these are well-maintained and widely used. Importing them into Grafana takes less than a minute, and they work out of the box once the data sources are configured.
Unified Dashboard
The community dashboards are thorough, but they are also dense. Each one has dozens of panels, and switching between two dashboards to get a complete picture quickly becomes tedious.
What I actually want when I open Grafana is a single screen that answers one question: is everything okay right now?
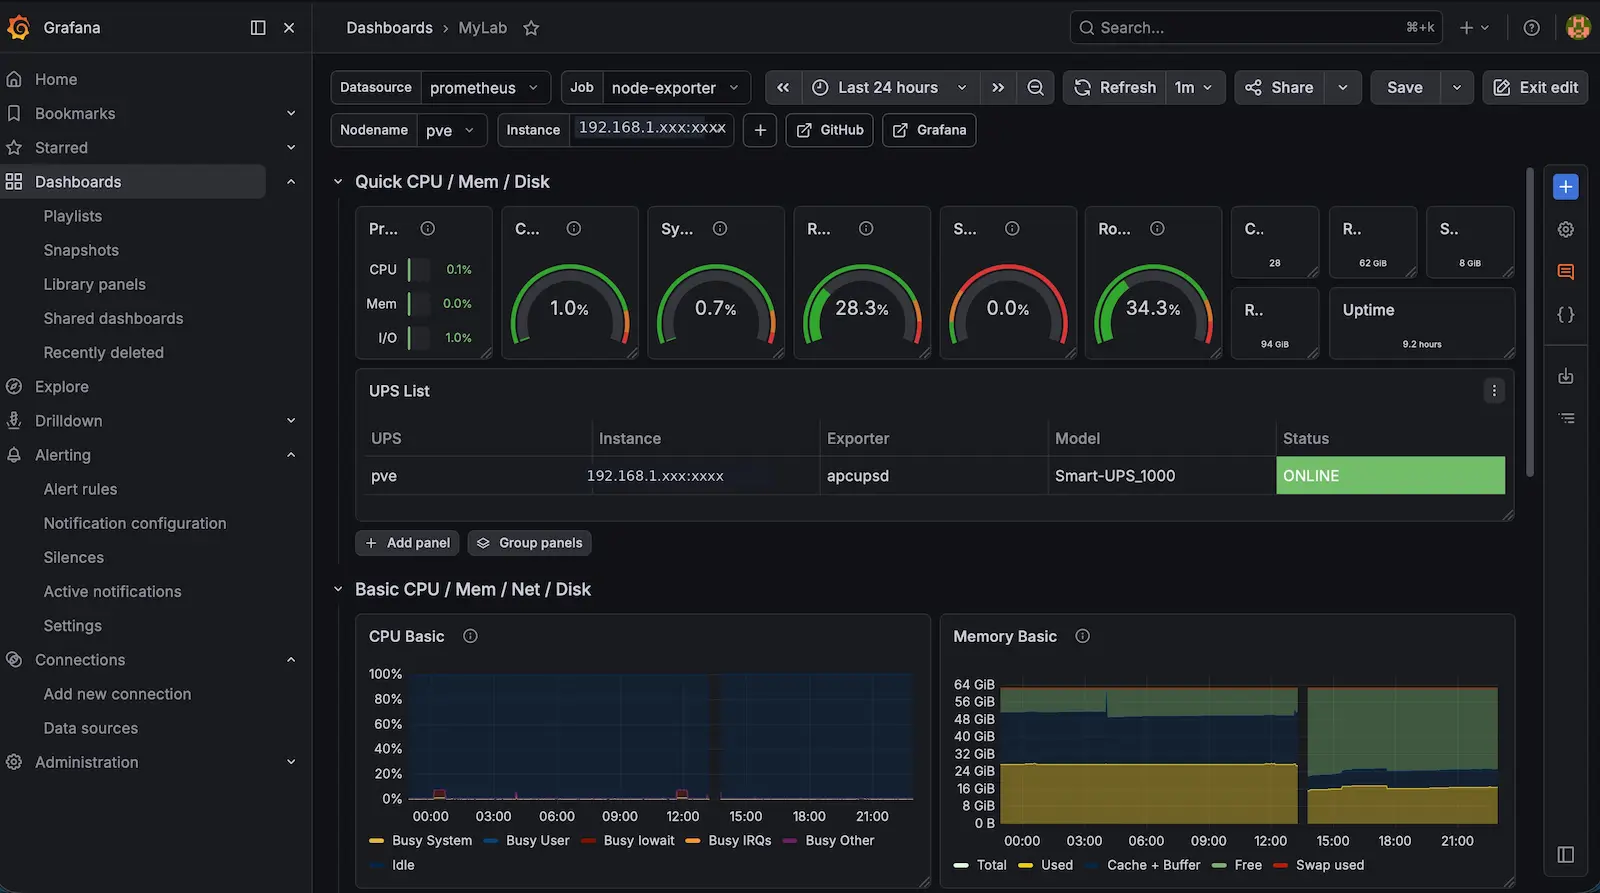
To get there, I started pulling the most important panels from both dashboards into a unified overview. The panels I care about daily are:
- CPU usage and temperature
- Memory utilization
- Storage pool capacity
- VM and LXC running status
- Recent log entries
- Active alert status
This unified dashboard is still a work in progress. The full community dashboards remain available when I need to drill into a specific issue, but the single-pane overview is what I actually use every day.
Alerting: Grafana and Telegram
Dashboards are useful, but they still require someone to look at them. The real value of monitoring comes from alerting: the system tells you when something is wrong, instead of waiting for you to notice.
I use Grafana’s Unified Alerting feature connected to a Telegram bot. When an alert condition is met, Grafana sends a message to a Telegram chat. My phone buzzes, I read the message, and I know exactly what needs attention.
Alert Conditions
The alerts I currently have configured:
- Proxmox Host DOWN — The most critical alert. If the host is unreachable, everything is down.
- node_exporter DOWN — If the exporter stops, metrics collection stops, so I need to know immediately.
- pve_exporter DOWN — Same logic as above for the Proxmox API exporter.
- CPU Usage > 90% — Catches runaway processes and stuck services. This is the alert that would have caught the Home Assistant CPU bug.
- Memory Available < 10% — Catches the gradual memory saturation I experienced on the old server.
- Disk Free < 10% — Storage fills up faster than you expect when running Immich, Nextcloud, and log retention simultaneously.
- VM DOWN — Alerts when any expected virtual machine stops running.
- LXC DOWN — Same for LXC containers.
- Storage Usage > 90% — Specifically monitors Proxmox storage pools, which is separate from the filesystem-level disk alert.
- UPS Power Switch — Alerts when the UPS switches from mains power to battery. In a Korean apartment, brief power fluctuations during summer are not uncommon, and knowing when the UPS activates gives me early warning of potential issues.
Why These Thresholds
The thresholds are deliberately set to alert early rather than at the point of failure. A CPU at 90% is not an emergency, but it is unusual enough for my workload that it warrants investigation. Memory at 10% remaining gives me time to identify the cause before the system starts swapping aggressively.
The UPS alert deserves special mention. It is not a server health metric in the traditional sense, but in an apartment environment where the server shares circuits with air conditioning and kitchen appliances, knowing when the power supply switches to battery is genuinely useful information. It has already helped me catch a situation where a circuit breaker was intermittently tripping.
What Hasn’t Worked Well
The most obvious irony of building a monitoring stack is that it adds more services to monitor. Prometheus, Loki, Grafana, node_exporter, pve_exporter, and Promtail are six additional components that can each fail independently. The monitoring system itself becomes infrastructure that needs to be maintained.
In practice, the stack has been remarkably stable. But the complexity is real. When Prometheus’s retention settings were not configured properly early on, the time-series database grew faster than expected and started consuming significant disk space. That was a problem I created by adding monitoring, not one that monitoring solved.
The other limitation is the current scope of log collection. Promtail only collects logs from the Proxmox host, which means I have no centralized visibility into what happens inside individual VMs and LXC containers. If Home Assistant logs an error, I still need to check it manually inside the VM. Extending Promtail or deploying additional agents into each container is the logical next step, but it also multiplies the configuration and maintenance effort.
Finally, the Grafana unified dashboard is still not where I want it to be. The community dashboards are excellent for deep dives, but building a clean single-pane overview that shows exactly the right level of detail requires more time and Grafana experience than I initially expected. Like the Home Assistant dashboard situation I described in a previous post, the gap between what Grafana can do and what it does by default is wide.
Lessons Learned
The biggest lesson is simple: monitoring should be set up before you need it, not after an incident convinces you. Both of my early problems would have been trivial to detect with even basic alerting. The investment in building the stack is small compared to the cost of discovering issues days or weeks after they start.
Choosing Prometheus and Loki over heavier alternatives like the ELK stack was the right call for a homelab. The resource footprint is manageable on a single server, and the integration with Grafana is seamless. For anyone running Proxmox at home, the combination of node_exporter and pve_exporter covers almost everything you need to know about your system.
Telegram as an alert destination has been perfect for a homelab context. It is always on my phone, notifications are immediate, and configuring a Telegram bot is far simpler than setting up email alerting. For a single-person operation where I am the only one who needs to be notified, it is the right tool.
The most practical advice I can offer is to start with community dashboards and existing alert rules rather than building everything from scratch. Import the well-known dashboards, configure a handful of critical alerts, and iterate from there. The goal is not a perfect monitoring setup on day one. The goal is knowing when your server is on fire before you smell the smoke.
What’s Next
The immediate priority is extending log collection into individual VMs and LXC containers. Home Assistant, Nginx Proxy Manager, and Nextcloud are the services most likely to produce logs worth monitoring, and getting those into Loki would close the biggest remaining gap.
Beyond that, I want to refine the unified Grafana dashboard into something I am genuinely satisfied with. The information is all there. It is just a matter of presentation, which is exactly the kind of problem that takes longer than you expect.
There is also the question of monitoring the monitor. Right now, if the monitoring LXC itself goes down, I have no way to know unless I notice that Telegram alerts have stopped arriving. A simple external health check, perhaps through Uptime Kuma or a cloud-based ping service, would close that loop. It is monitoring all the way down, and at some point you have to decide where the turtles stop.